Eagle 3D Streaming API reference: what you can automate outside the Control Panel
Automate streaming reports and status checks with the Eagle 3D Streaming API. Endpoints, API key setup, Node.js example, limits and fixes.
 Eagle 3d Streaming
September 24, 2026
8 min read
The Eagle 3D Streaming Control Panel covers most day-to-day work. You upload apps, create configs and check analytics there. Some jobs are easier from code, though, like monthly usage reports or a status banner on your own site.
That's what the Eagle 3D Streaming API is for. Its reference documents two endpoints: an Analytics API for session data and a Service Health Check API for platform status. This guide covers both, plus the API key they share and the limits to plan around.
Step 1: get your Eagle 3D Streaming API key
Both endpoints authenticate with your personal Eagle 3D Streaming API key. You'll find it in the developer section of the Control Panel. The API key guide shows the exact screens.
Treat this key like a password. Keep it in an environment variable or a secrets manager, not in front-end code. Anyone holding it can pull your account's streaming data.
The Eagle 3D Streaming Analytics API
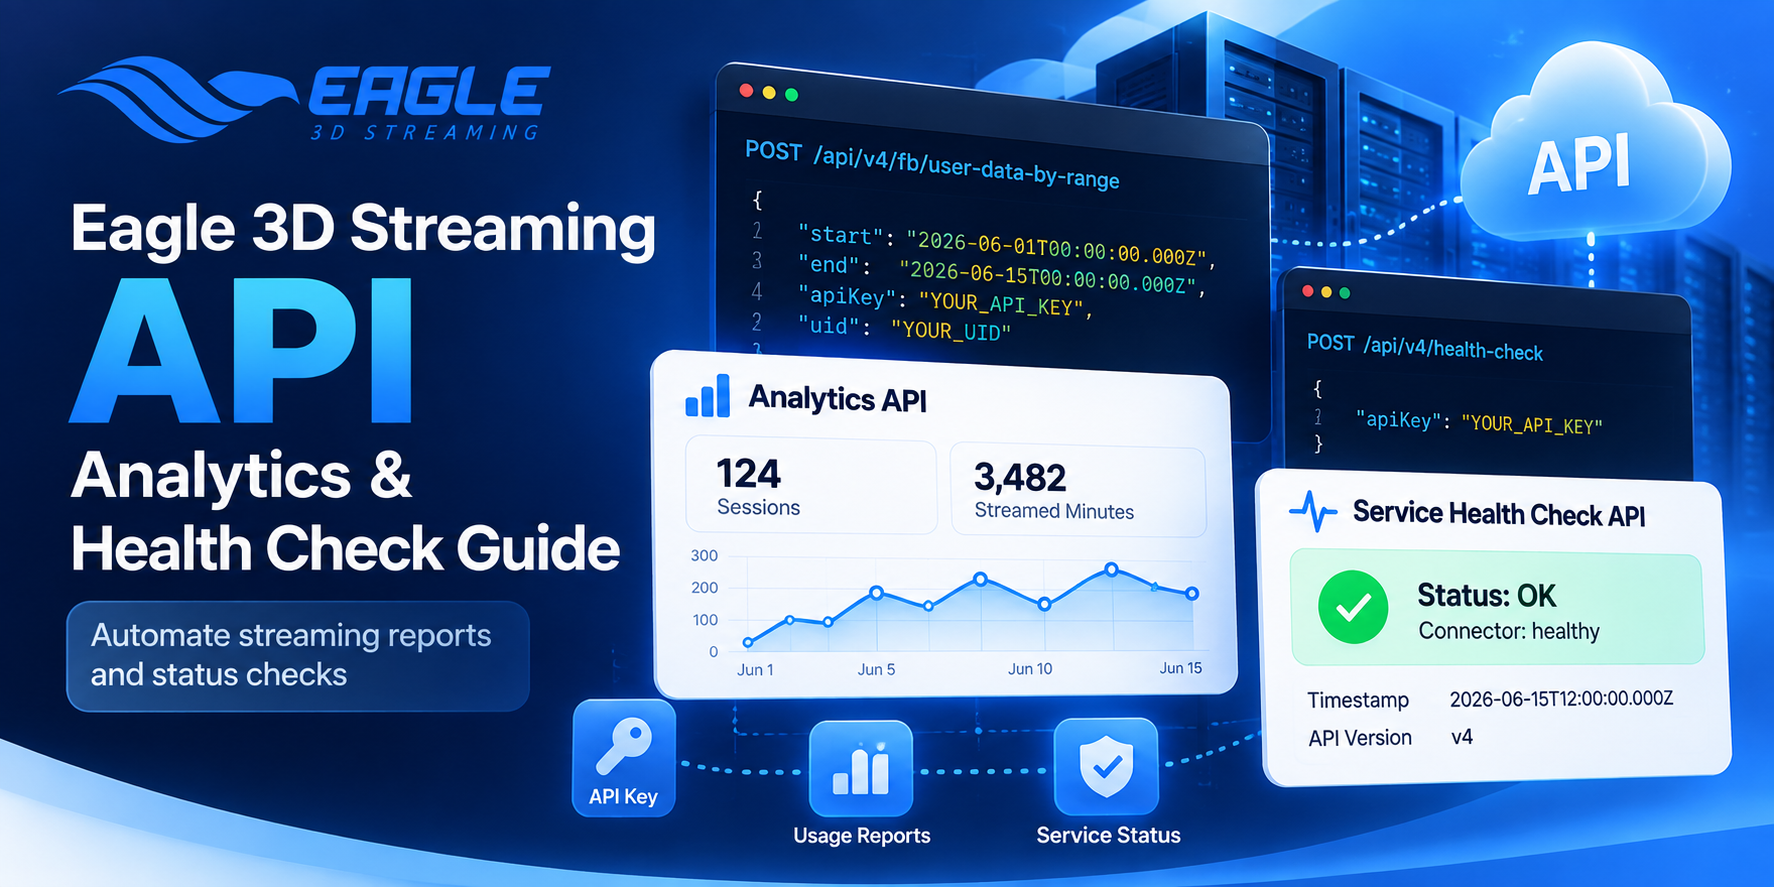
The Analytics API returns streaming session data for a date range. You can use it to monitor overall activity, pull session-level records and analyse usage over time. It's built for reporting, such as a weekly usage email or a billing reconciliation script. Send a POST request to this endpoint with a JSON body of four fields:
POST https://agw.eagle3dstreaming.com/api/v4/fb/user-data-by-range
{
  "start": "2026-06-01T00:00:00.000Z",
  "end": "2026-06-15T00:00:00.000Z",
  "apiKey": "YOUR_API_KEY",
  "uid": "YOUR_UID"
}
start and end are ISO 8601 UTC timestamps, and both are required. The apiKey comes from the Control Panel. The uid is your Eagle 3D Streaming user ID, and you get it from the support team.
What the Analytics API returns
A successful call returns three top-level fields. count is the number of sessions in the range. streamedMinutes is the total minutes streamed, and data holds one record per session.
Each session record includes the app name and version, plus the viewer's city and country. It also has start and stop times and streamTime in minutes. That's enough to answer most usage questions. You can see which app gets the most traffic, where viewers are and how long sessions last.
The response mixes all your apps together. There's no way to filter by app in the request. To report on one app, filter the results on the appName field in your own code.
A quick Node.js example
Eagle 3D Streaming's docs include a working example using Node.js and Axios. Here's a trimmed version:
const axios = require("axios");

const API_URL = "https://agw.eagle3dstreaming.com/api/v4/fb/user-data-by-range";

async function getUsage(uid, apiKey, start, end) {
  const res = await axios.post(API_URL, { uid, apiKey, start, end }, {
    headers: { "Content-Type": "application/json" },
  });
  return res.data;
}

getUsage("YOUR_UID", process.env.E3DS_API_KEY,
  "2026-06-01T00:00:00.000Z", "2026-06-15T00:00:00.000Z")
  .then((data) => console.dir(data, { depth: null }))
  .catch((err) => console.error(err.response?.data || err.message));
You can also try the endpoint without writing code. Eagle 3D Streaming has a Swagger UI for exploring and testing the API. It's a quick way to check your key and UID before you build anything.
The Eagle 3D Streaming Service Health Check API
The second endpoint tells you whether the Eagle 3D Streaming pixel streaming service is up. It needs only your API key. Send a POST request here, with a body of just that key:
POST https://agw.eagle3dstreaming.com/api/v4/health-check
{ "apiKey": "YOUR_API_KEY" }
Reading the health check response
A healthy service returns "status": "ok" with "connector": "healthy". The response also includes a UTC timestamp and the API version. That's the result you want to see before a client demo.
An unhealthy status means part or all of the service is unavailable. The connector check will show unhealthy, with a message that one or more checks failed. An error status is different, because it points to a problem with your request, not the platform.
Two errors are worth knowing. An invalid key returns a 401 with "Invalid API Key". A missing key returns the code MISSING_API_KEY, so check your environment variables first.
What you can build with the health check
The docs list a few uses for this endpoint. You can show live service status in your app or feed it into uptime monitoring tools. You can also warn viewers when streaming is unavailable.
That last one fits well with an embedded stream. Check the service before loading your iframe, and show a clear message if it's down. The post on customising your E3DS iframe loading experience covers the loading side. Pair it with a health check, and viewers get an honest message instead of a blank spinner.
It also helps when a session drops. Run a health check first to rule the platform in or out. If the service is healthy, the cause is likely in your app. The post on why your session stopped mid-stream covers the usual suspects.
Limits to plan around
The Analytics API is rate limited. Go over the limit and extra requests may be rejected until the window resets. Each request also takes real processing on Eagle 3D Streaming's side, so avoid repeated or unneeded calls.
It isn't built for live dashboards either. Session data can take 30 seconds to a minute to appear after a session starts or ends. For a live view, use the Analytics section of the Control Panel instead.
Every request needs both a start and an end date. Requests without a valid range aren't supported. A daily or weekly scheduled job fits these limits well.
Troubleshooting common Analytics API errors
A 401 Unauthorized means your API key or UID is wrong or expired. Check the key in the Control Panel's developer section, and contact support if you don't have a UID. A Bad Request usually means a missing or badly formatted field.
Empty results mean no sessions happened in that range, so widen the dates. Missing recent sessions are usually just the processing delay. Wait up to a minute and try again.
"Too Many Requests" means you hit the rate limit. Slow your requests down and wait for the window to reset. For timeouts, retry after a short delay, then contact support if they continue.
Where the API fits with other Eagle 3D Streaming automation
The API covers reporting and status, not uploads. For pushing builds from code, Eagle 3D Streaming has separate tools. See CI/CD app upload automation and the automation tool.
Usage data also connects to cost control. Prepaid Minute plan users can set a Minutes Streamed Limit in the Control Panel. Pulling streamedMinutes from the API shows how close you are to that cap.
Conclusion
The Eagle 3D Streaming API is small, but it covers two useful jobs. The Analytics API turns session data into reports on your own schedule. The Health Check API tells your app, or your team, whether the platform is up.
Start with the Swagger UI to test your key and UID. Then schedule an analytics pull and add a health check before your embedded stream loads. Keep the rate limits in mind, and leave live monitoring to the Control Panel.
Ready to build on it? Start your free 7-day trial with 1 CCU and grab your API key from the Control Panel. Planning reporting across many apps or clients? Book a demo with the Eagle 3D Streaming team. Need a UID or stuck on an error? Contact support or ask in the Discord community.
FAQs
What can the Eagle 3D Streaming API do?
The API reference documents two endpoints. The Analytics API returns streaming session data for a date range. The Service Health Check API reports whether the pixel streaming service is operational.
Where do I find my Eagle 3D Streaming API key?
It's in the developer section of the Eagle 3D Streaming Control Panel. The API key guide in the docs shows each step. Keep the key server-side, never in front-end code.
How do I get my UID for the Analytics API?
Contact the Eagle 3D Streaming support team if you don't have it. The UID is a unique ID assigned to your account. You need it alongside your API key for every analytics request.
Can I filter analytics by a single app?
No, the request returns sessions from all your apps. Filter the results by the appName field in your own code. This works the same for any number of apps.
Can I use the Analytics API for a live dashboard?
It isn't designed for that. Data can take 30 seconds to a minute to appear, and requests are rate limited. Use the Control Panel's Analytics section for a live view.
What does an "unhealthy" health check status mean?
Part or all of the Eagle 3D Streaming service is unavailable. The connector check shows unhealthy, and a message explains that checks failed. An error status means your request itself failed, often because of the API key.
For every field and example, see the Analytics API docs and the Service Health Check API docs. Both pages include full request and response samples.
Share this article